The EPA Model: A Gentle Introduction
The math behind EPA can be a bit confusing. This page will help you understand the EPA model, how it works, and how to best use it. No math required!
Welcome to Statbotics
Hi! I'm Abhijit, and I'm the founder of Statbotics. I'm so glad you're here! My goal with Statbotics is to share FRC data and analysis with a wider audience. Hopefully this page will help you better understand the EPA (Expected Points Added) model, its advantages and disadvantages, and how to best use it. If you still have any questions after reading, feel free to reach out to me on Chief Delphi or via email at avgupta456@gmail.com. Let's get started!
Why do we need the EPA model?
Two factors make strategy in FRC interesting. First, there is a new game every year, with new rules, new strategies, and new robots. Second, teams compete in alliances, making it difficult to directly attribute success or failure to a single team. If one alliance beats another, did certain teams contribute more or less than others? Should we assume that every robot in the winning alliance will win their next match?
Scouting is a great way to better understand the strengths and weaknesses of other teams at an event, but it is impractical to scout every team at every event in the world. EPA stands for Expected Points Added and estimates how much a team scores in an average match using a few simple inputs and some statistics. Although it is not perfect, it can augment scouting data and reveal insights and trends.
Why not use OPR or Elo? (Click to expand)
How does the EPA model work?
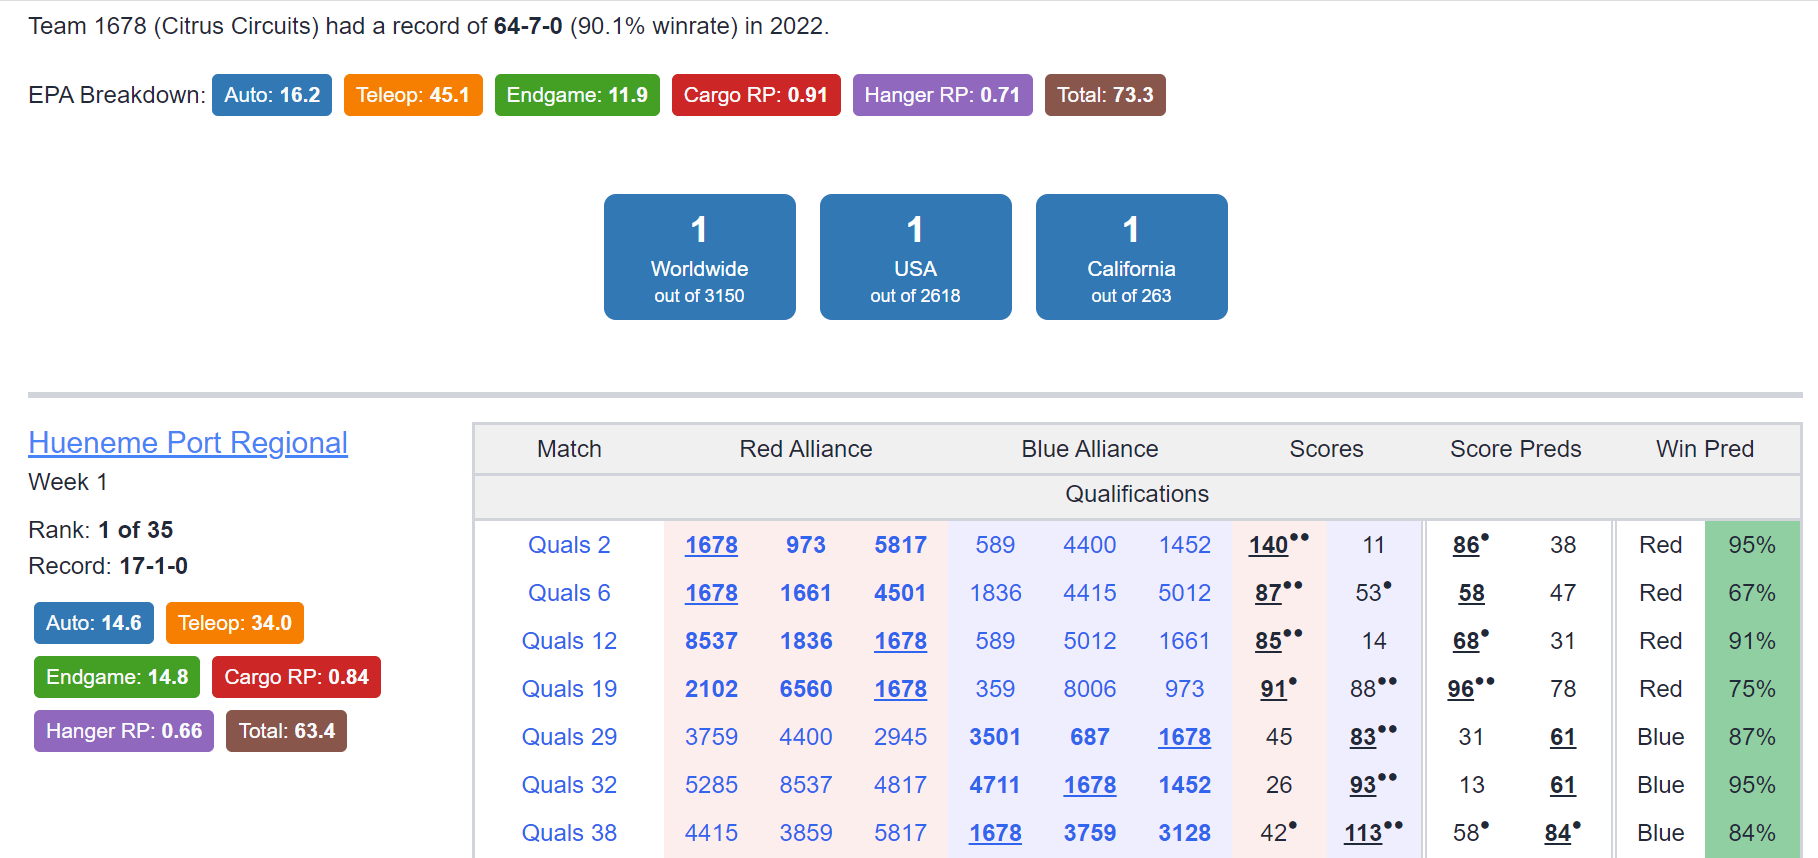
At it's core, the EPA model is simply a moving average of a team's performance. Initially, every team starts with an EPA rating (more on this later). To predict a match score, simply add up the EPA ratings of each team in the match. The alliance with the higher EPA rating is expected to win. After the match, the EPA ratings of the teams are updated. The difference between the predicted score and the actual score is called the "error". The EPA ratings of the teams are updated based on the error. Statbotics also computes component EPAs, which measures a team's contribution to autonomous, teleoperated, and endgame scoring, and ranking point EPAs, which measures a team's contribution to bonus ranking points.
If a team's EPA rating is too high, it will be penalized for overestimating its performance. If a team's EPA rating is too low, it will be rewarded for underestimating its performance. The amount of penalty or reward is proportional to the error. Over time, teams' EPA ratings will converge to their true performance. This is the same concept behind Elo.
What other factors does the EPA model consider? (Click to expand)
How can I use the EPA model?
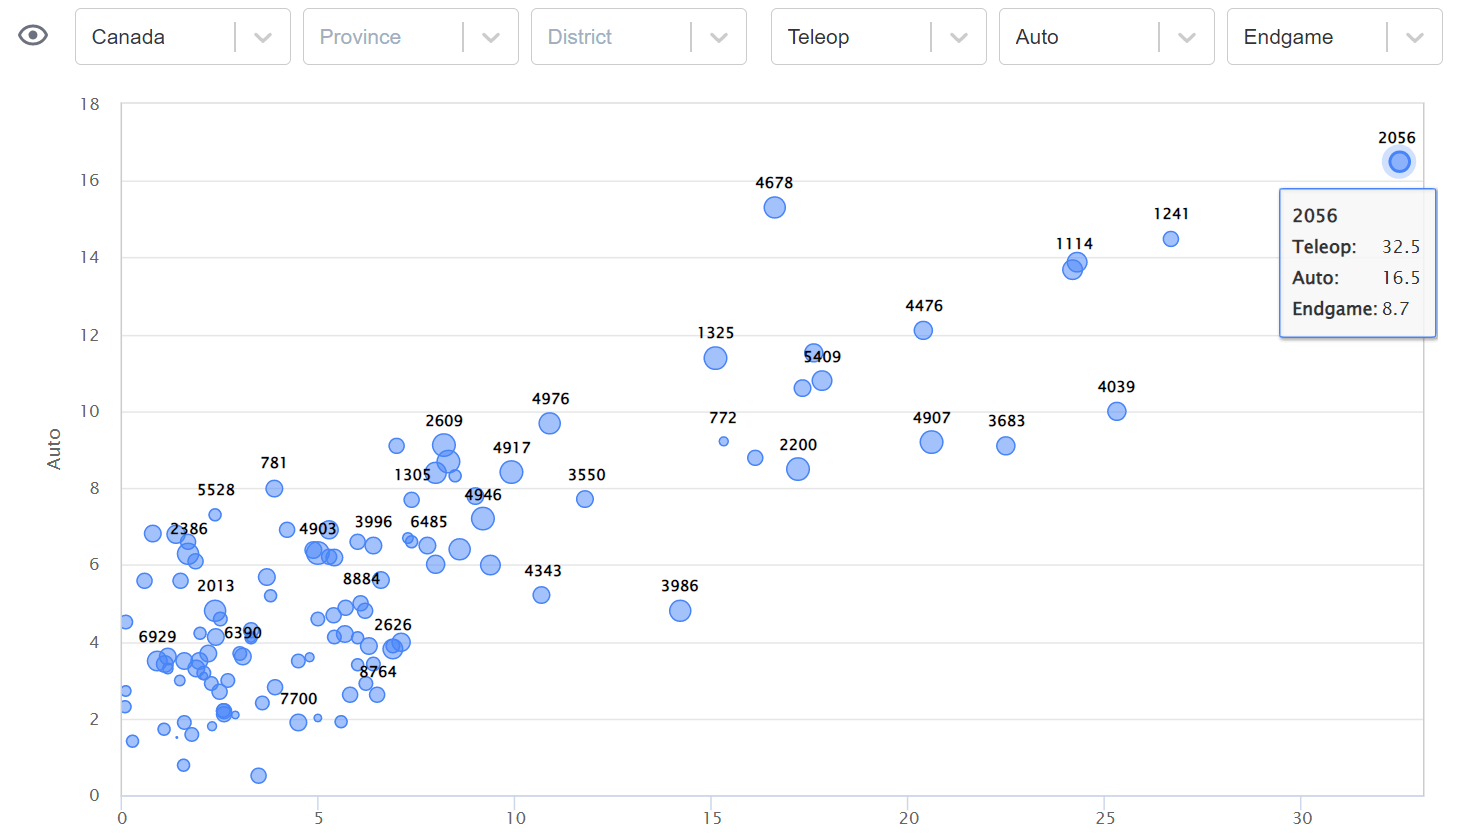
At an event, you can use the EPA model to predict match scores and estimate an alliance's chances of winning a match. You can simulate the outcomes of multiple matches to forecast your team's ranking at the end of the event. You can also compare teams at the event to see which teams would be the best alliance partners. As the season progresses, you can use the EPA model to compare teams across events and locations. You can look ahead to future events and see which teams are likely to perform well. You can also access historical data to see past trends and patterns.
The EPA model will get matches wrong sometimes. This is unavoidable. I have spent time to ensure the model is calibrated, meaning a 70% prediction is roughly 70% accurate. But that does mean the prediction will be wrong 30% of the time. Take all predictions and ratings with a grain of salt.
Advantages of the EPA model (Click to expand)
Disadvantages of the EPA model (Click to expand)
Frequently Asked Questions
- Where can I access EPA data? Congratulations on finding the Statbotics website! This is the primary home for everything EPA. Check out the various tabs and links to get a feel for the site. There are also Python and REST APIs available for developers to integrate EPA into their own applications.
- How much do past seasons affect results? Using data from past seasons helps the EPA model adapt to a team's performance in the early stages of a season. After a few matches, the EPA model will be based primarily on the current season's data. By your second event, your EPA rating will be almost entirely based on the current season's data.
- What do the colors mean? The website uses a color scheme to visually represent the percentile of a team's EPA rating relative to other teams. The blue highlight represents the top 1% of teams, the dark green highlight represents the top 10% of teams, and the light green highlight represents the top 25% of teams. Most teams are not highlighted (25% to 75%), and the bottom 25% of teams are highlighted in red.The colors are designed to be easy to read and distinguish between teams.
- Where can I learn more? Check out the rest of the blog posts for more information on the derivation and implementation of the EPA model. You can also read the Chief Delphi thread to learn more about active development.
- How can I report bugs/feature requests? Feel free to share them on the Chief Delphi Thread. You can also use the Canny link in the header dropdown or contact me directly (email linked above).